The Community Growth Report displays a bar graph indicating student % meeting benchmark on selected measures compared to waves of administration. Student average scores for the selected measure can also be viewed.
Instructions:
Step
1
Locate the red banner Screening, Progress Monitoring and Observation on the dashboard and click on the assessment for which you would like to produce reports, for example CIRCLE Progress Monitoring PreK, Texas Kindergarten Entry Assessment or TPRI. The following screenshots show the steps to pull this report in CIRCLE Progress Monitoring, but the steps are the same for all the assessments on CLI Engage.
Step
2
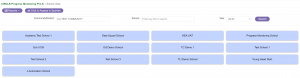
Locate your community.
Step
3
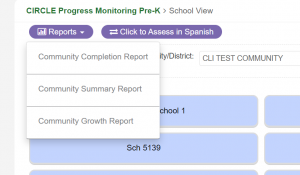
In the community view of schools, click on the Reports drop down, and then click on Community Growth Report.
Step
4
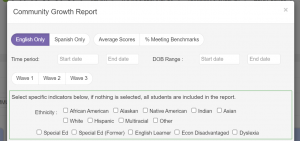
Make desired selections for running the report.
- Select language
- Choose either % Meeting Benchmarks or Average Scores
- Input Time Period and DOB Range (optional)
- Choose Waves, in order to see growth, you’ll want to compare waves so select at least two waves
- Choose specific indicators (if needed)
Step
5
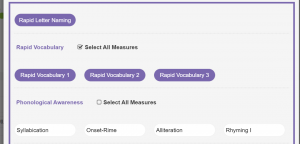
Then select the measures to include in the report. You can select one or multiple measures.
Step
6
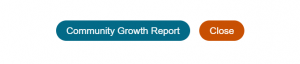
Scroll to bottom and click on Community Growth Report.
Step
7
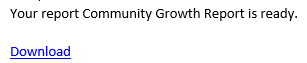
A link to the report will be sent to your email. Open the email and click on the download link.
Step
8
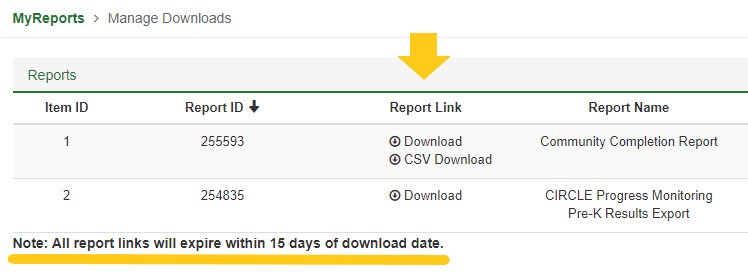
As an alternative to using email, you can easily access the link to download your report results from the dashboard by using My Reports.
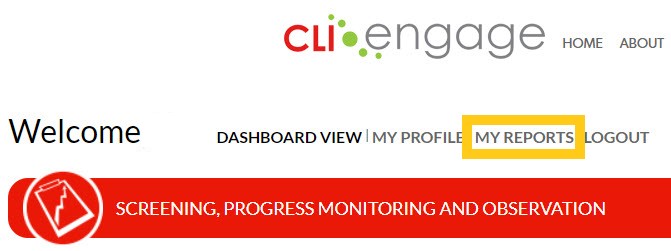
My Reports will conveniently store your report links for up to 15 days.
Step
9
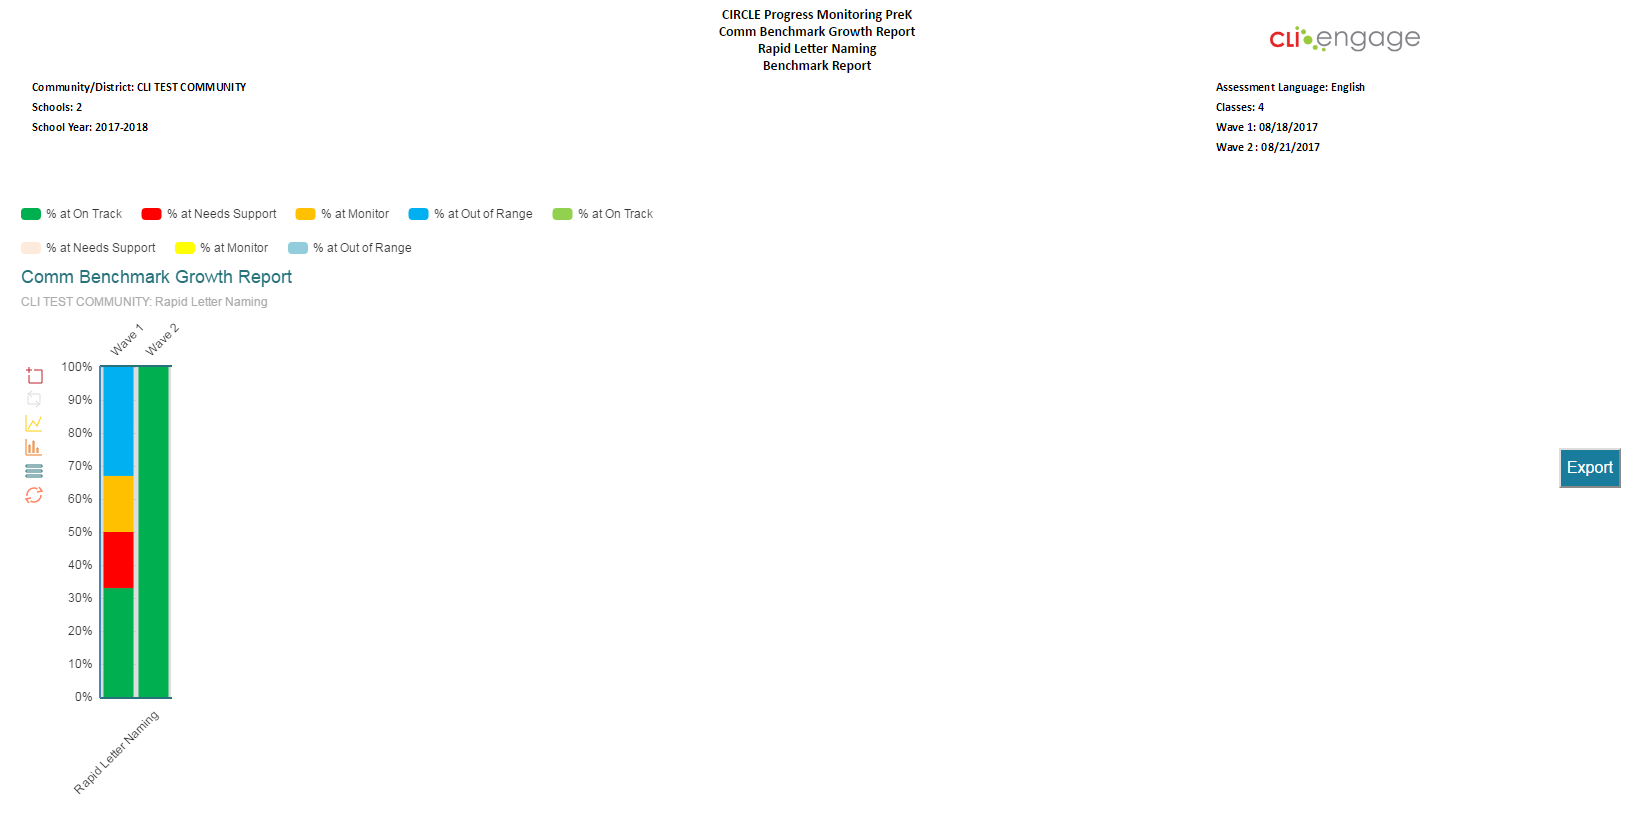
The report will build as the report downloads.
Step
10
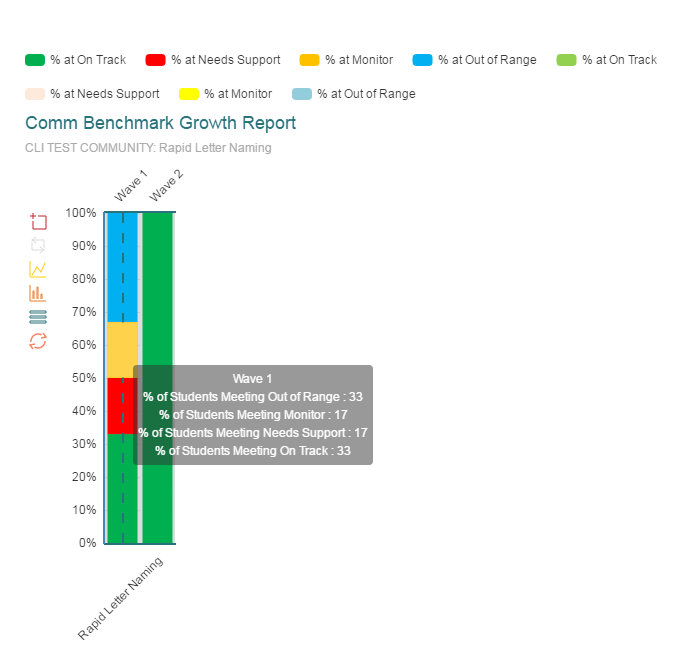
The % Meeting Benchmarks report option displays a bar graph. You can hover over the table with your cursor to see the student percentages for the waves of administration.
Step
11
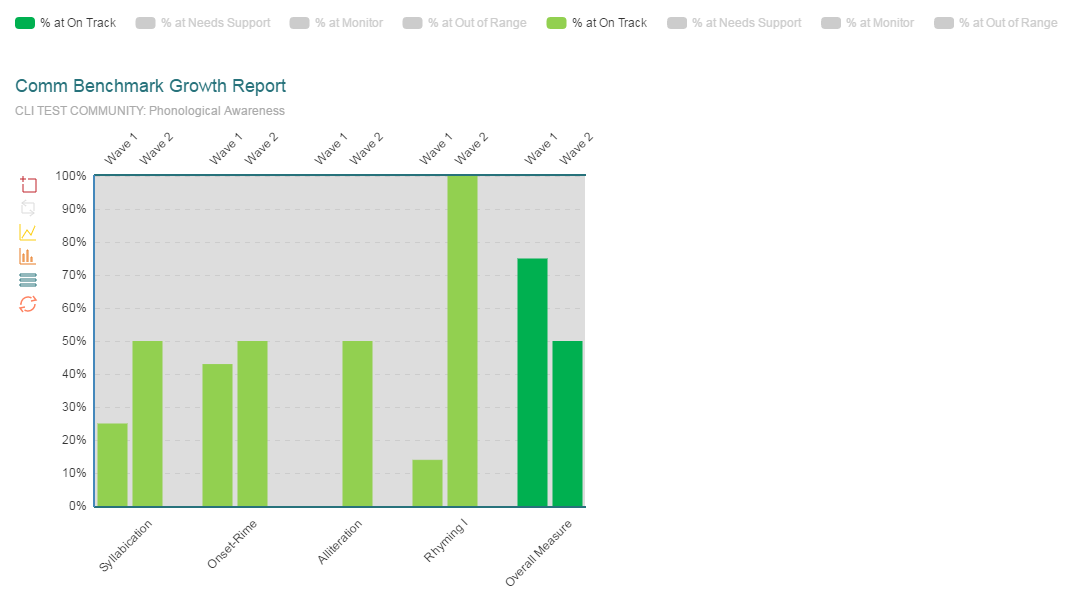
You can manipulate the view by decreasing the bar colors to see specific growth development only. In this example, by clicking on the colors above the graph, you can create a growth report that shows only proficiency gains.
Step
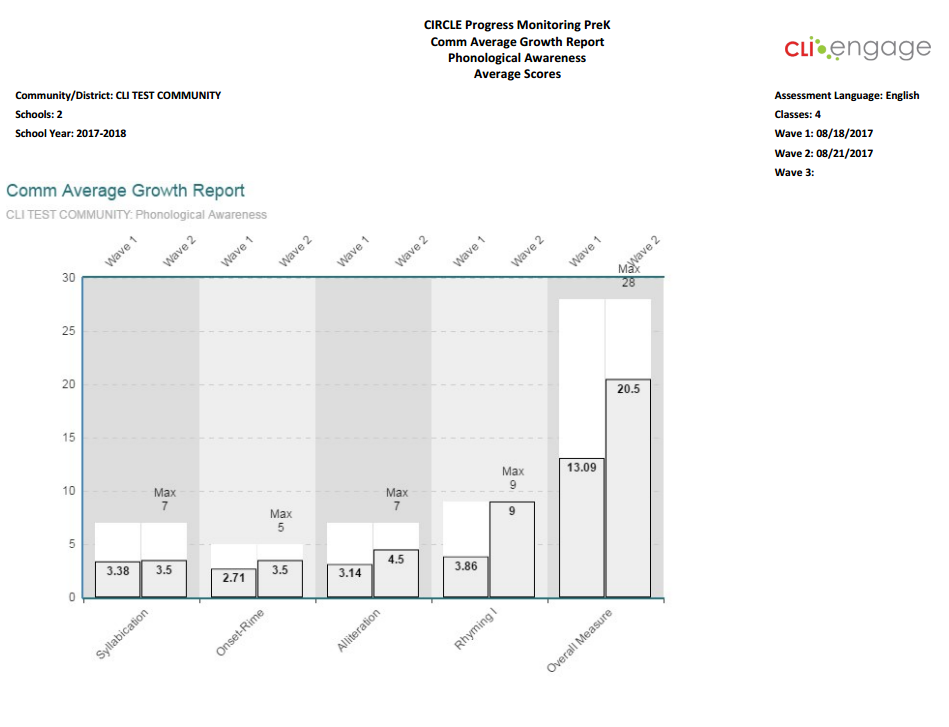
12
The Average Scores report option indicates the average score for all students tested in the community in the measure or sub-measure indicated out of a maximum total.
Step
13
When finished, click the Export button to save as a PDF file.

This document was last modified on: August 5, 2022