This guide will assist you in creating and understanding the multiple report features that are available for the Classroom Observation Tool.
Instructions:
Step
1
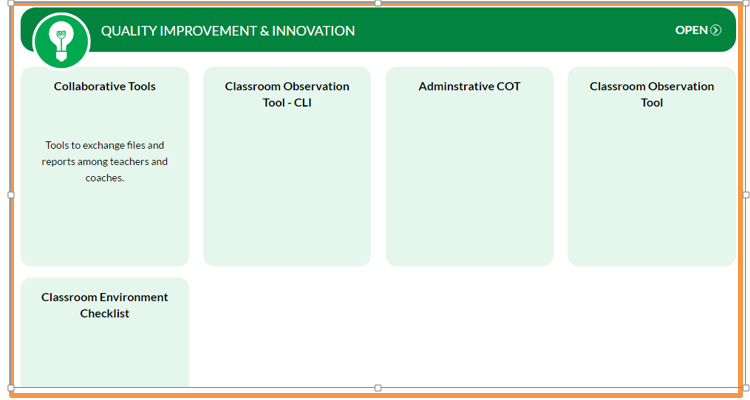
On the dashboard, locate the Quality Improvement tab. Click on Classroom Observation Tool.
Step
2
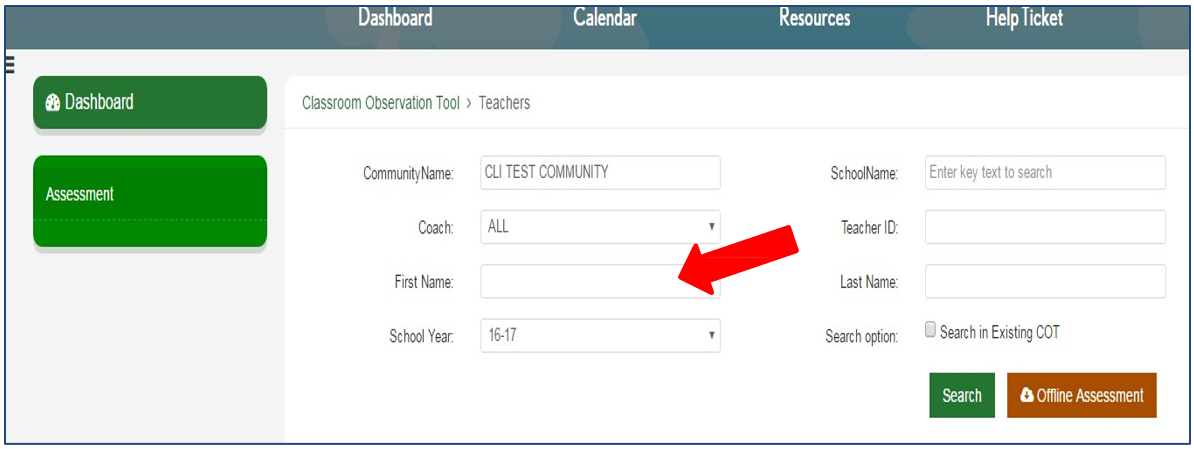
The Community Name field should have your community or school district name already showing. Enter school name if required. You may see a drop down if there are several schools. Select the school where the teacher is assigned.

Step
3
Note that since there is no assigned role as coach you do not need to enter anything in this field. If you have access to administer the COT with a teacher then you can search for the teacher and view reports.
Step
4
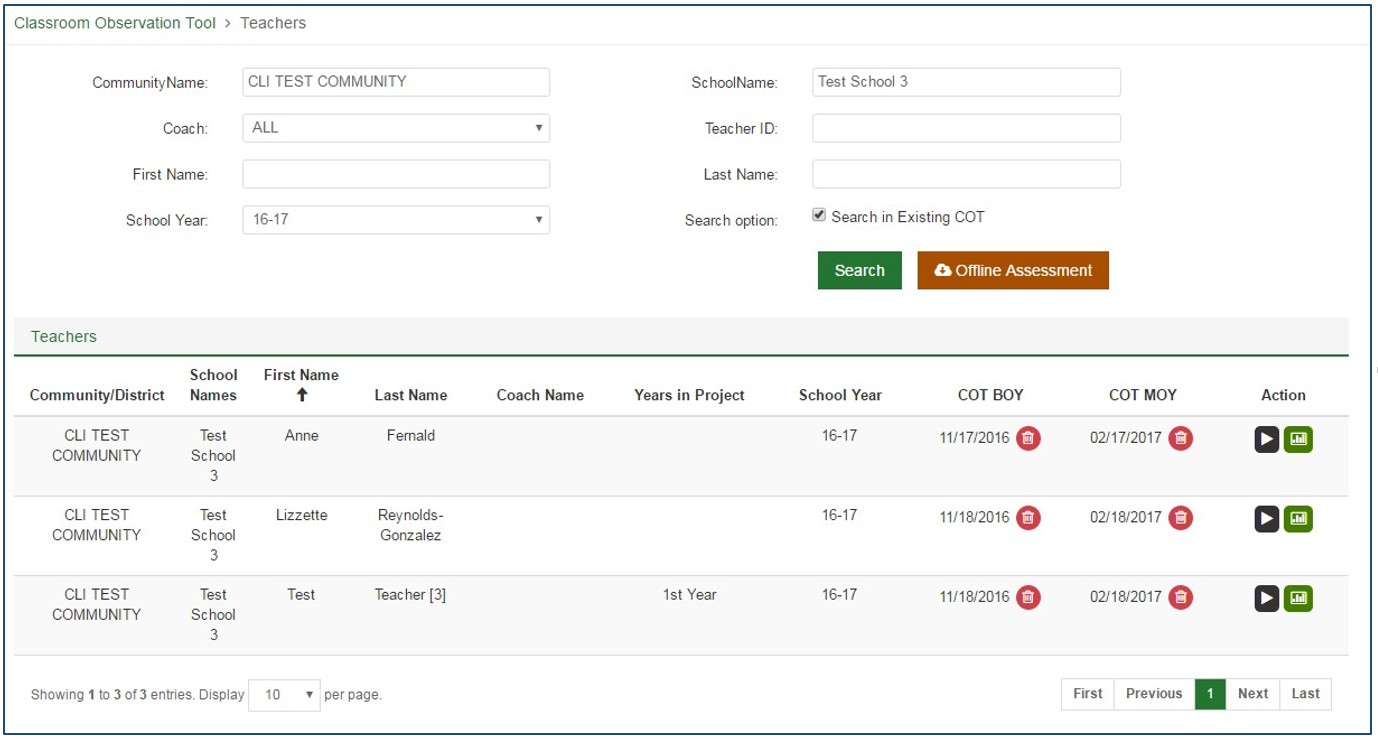
Check the box for ‘search in Existing COT’ for teachers that have a completed COT.

Step
5
You will then see the list of all teacher’s completed COTs.
Step
6
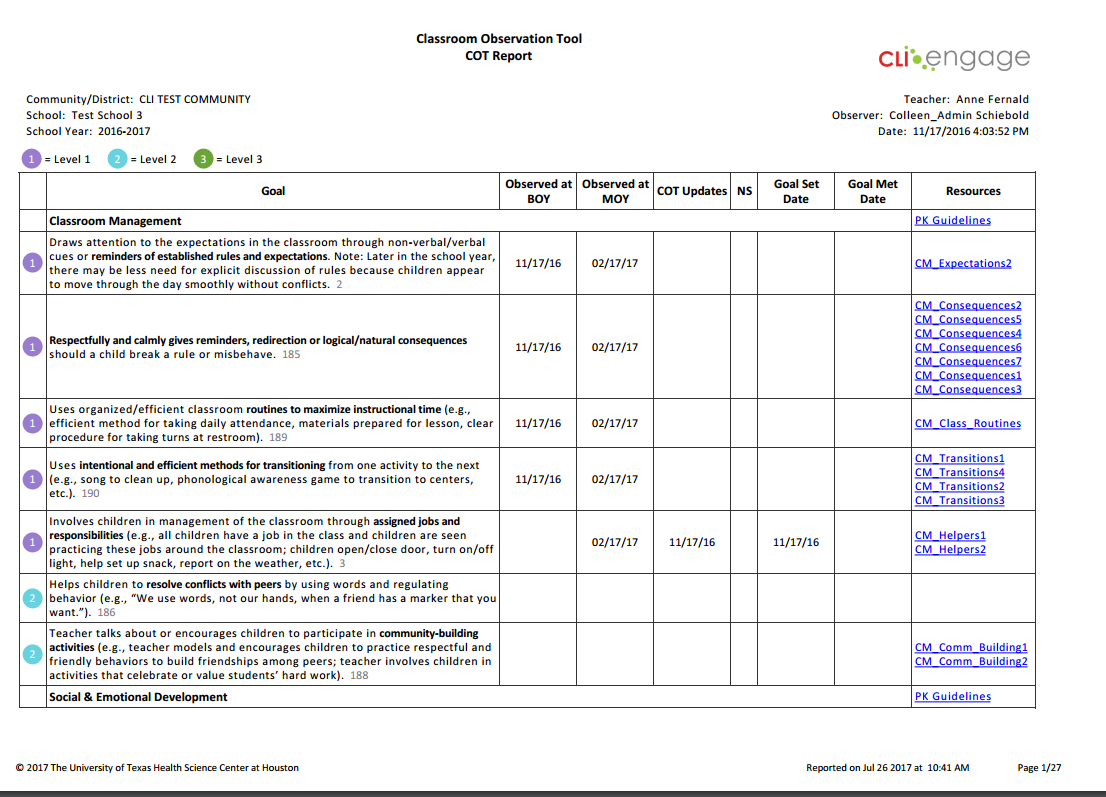
The COT Report (BOY/MOY)
Step
7
To view the full COT report, locate the teacher’s COT you wish to view and click the ![]() icon.
icon.

Step
8
You can then view item indicators observed during BOY and /or MOY as well as any additional updates and current goal status.
Step
9
COT Growth, Observed Strategies, Item and Summary reports
Step
10
Click on the green “Report” button in the Action column
Step
11
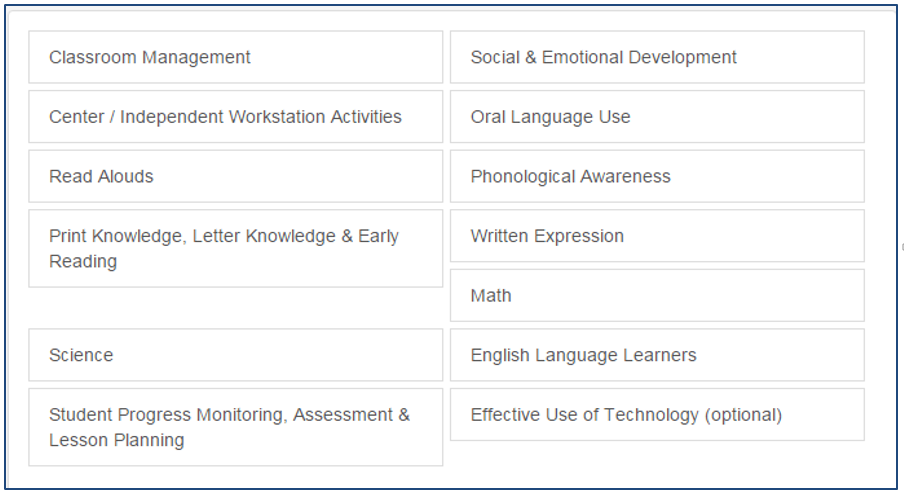
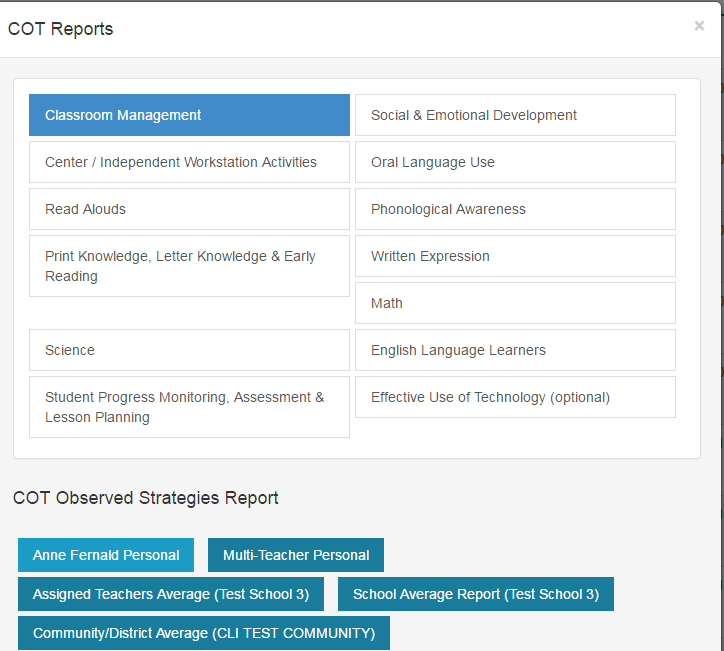
Select COT domains you want to view.
Step
12
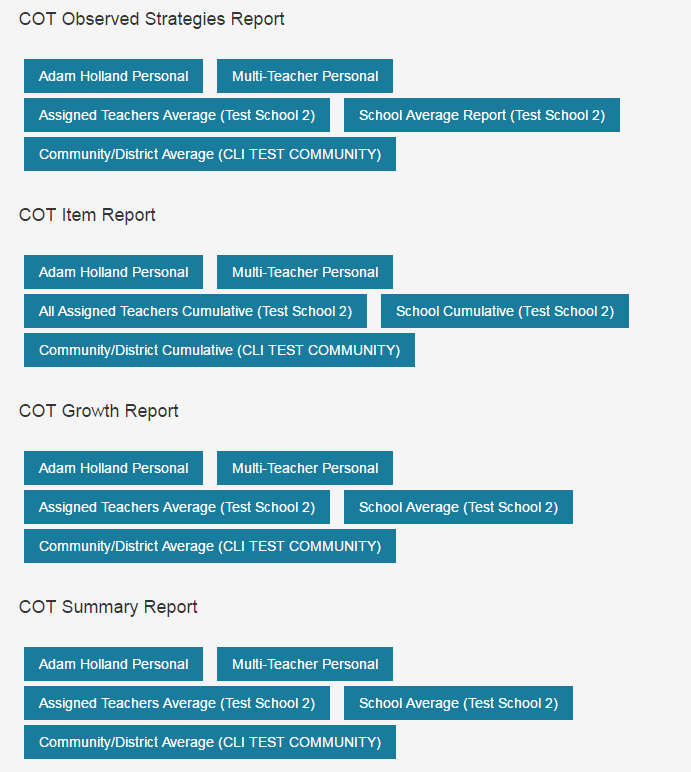
Select the type of Report you want to view. The COT Strategies report shows the number of goals met within each domain. The COT Item report shows the items mastered by the teacher(s) on the selected domain. The COT Growth report shows the cumulative number of domain items mastered each month. The summary report provides a summary of all continuous improvement actions taken for items observed and not observed
Step
13
To create a report, select the report scope: individual teacher’s name, all assigned teachers, school, or community level. The report will then automatically create.
Step
14
COT Growth Report
Step
15
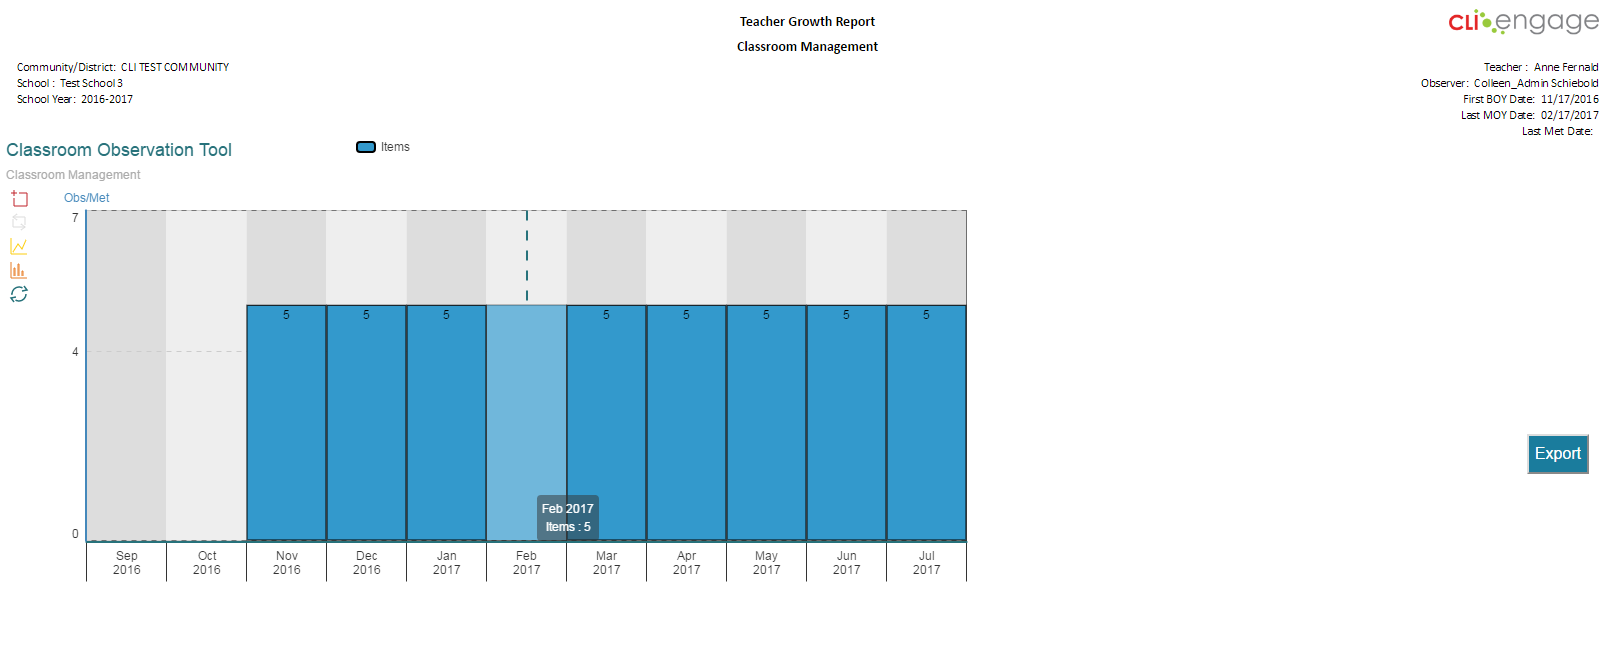
You can view this report by changes reflected from BOY to MOY, new COT update items added or new goals This is a cumulative report and the bar from month to month will increase as additional domain mastery is recorded.
Step
16
Hover over bars to see total number of items observed in month indicated.
Step
17
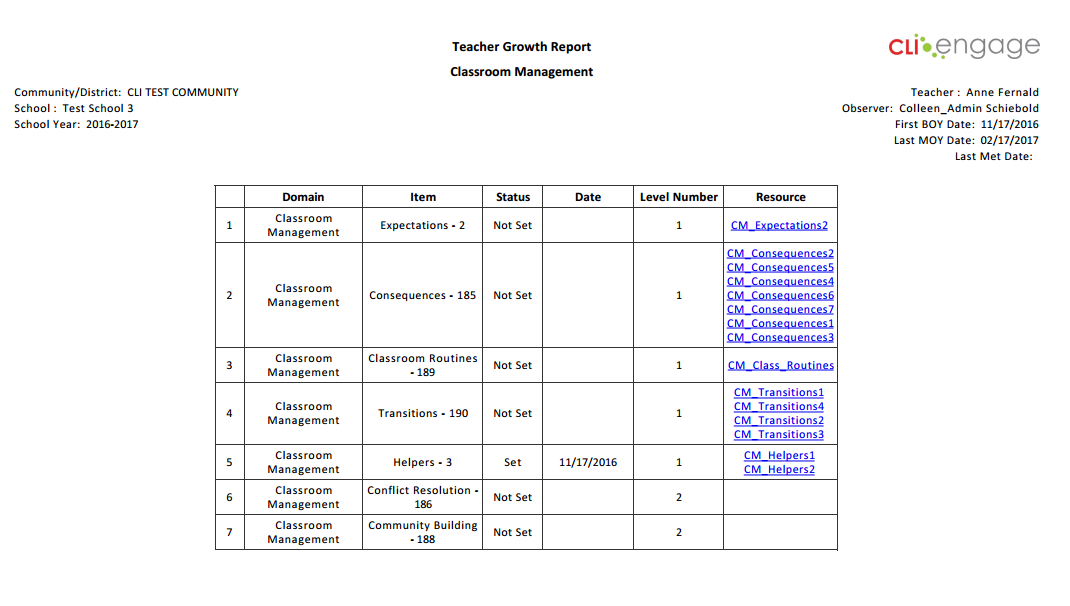
Table below graph shows items set and not yet set to guide in selecting additional goals.
Step
18
COT Observed Strategies Report.
Step
19
This report will show all selected domains
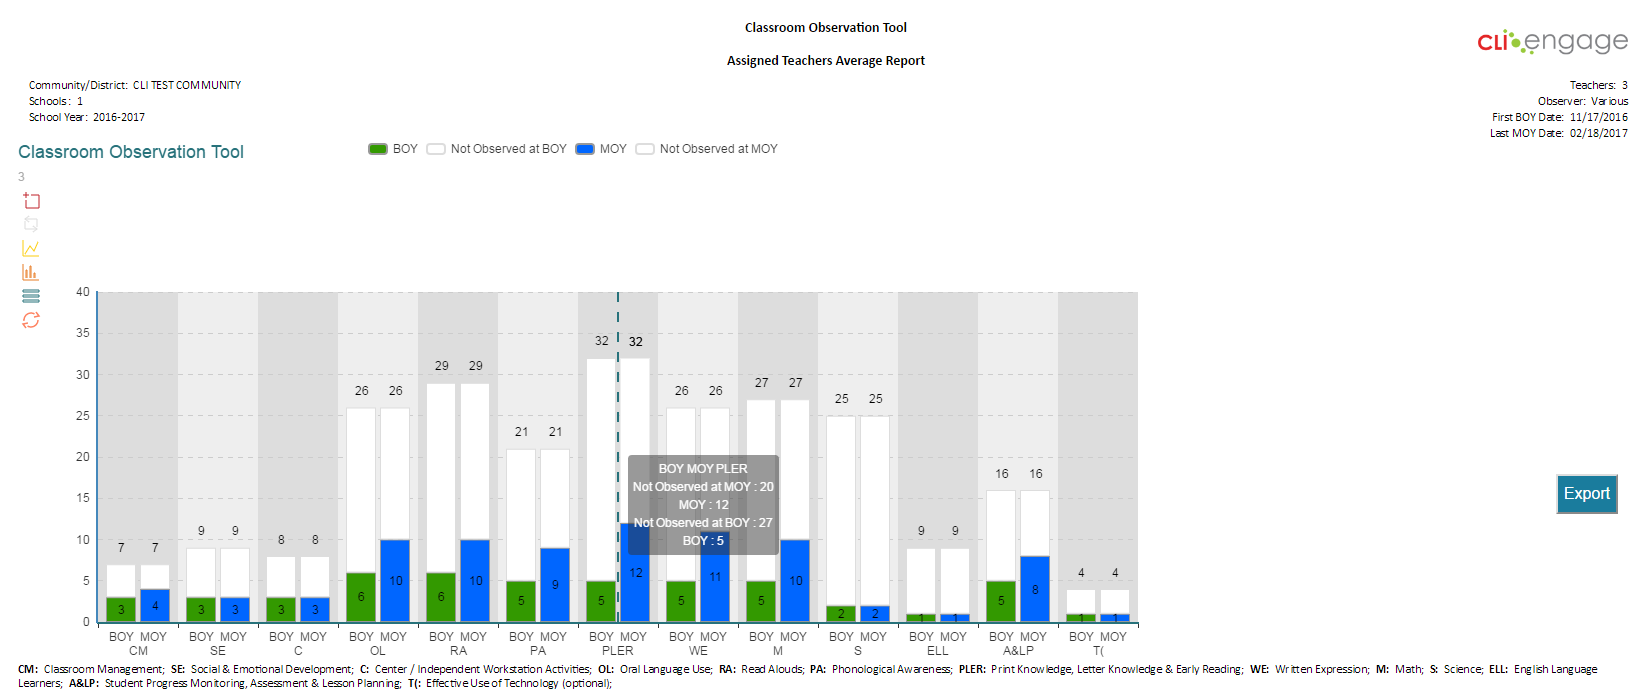
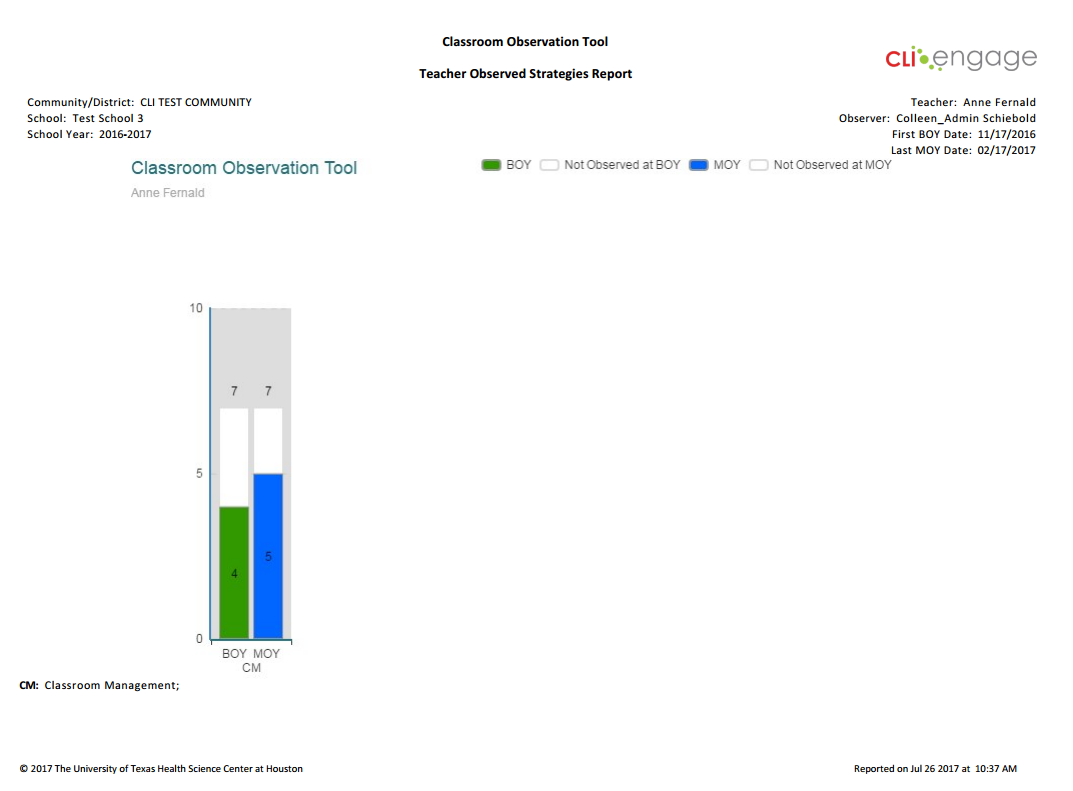
Note in the report sample below, this shows a campus- wide side by side comparison of BOY to Each domain is listed below the chart. The top of the page identifies the school and # of teachers.
Hover over the bar to see total number of observed and not observed indicators.
Step
20
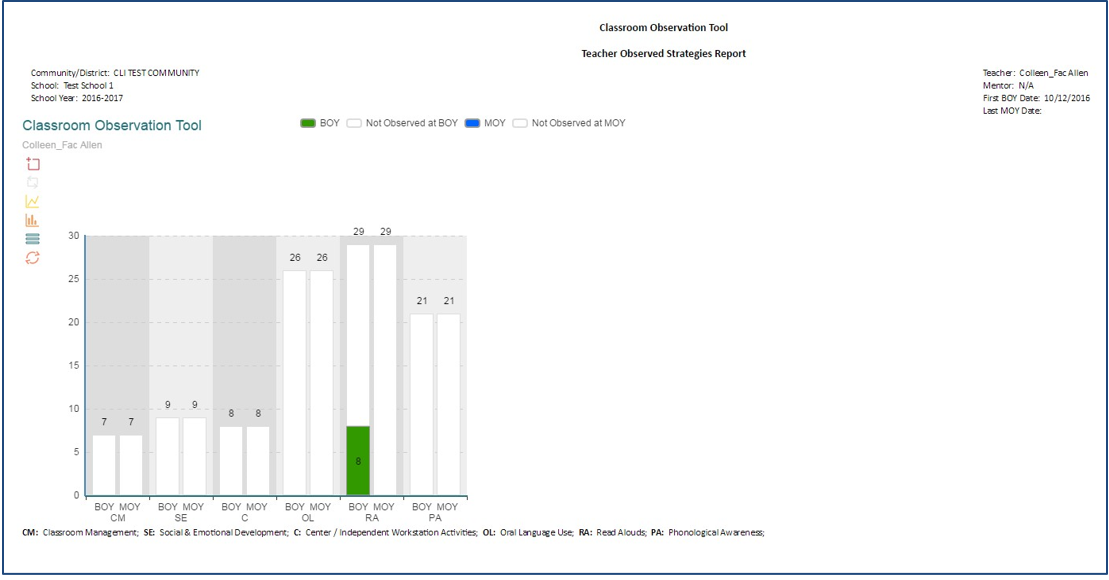
Note the number at the top of each bar indicates the total number of strategies within each The green colored bar represents BOY and shows the total number of strategies mastered within that domain. If the MOY COT is complete then the blue colored bar represents MOY. No color indicates the strategy was not observed.
Step
21
All reports can also be generated for the individual teacher. Select the domains you want to view and then select the name of the individual teacher
Step
22
The report will generate a strategy comparison for each domain selected.
Step
23
You can also select “Multi- Teacher Personal” to view individual results in one report for all of the teachers at the school.
![]()
Step
24
COT item report.
Step
25
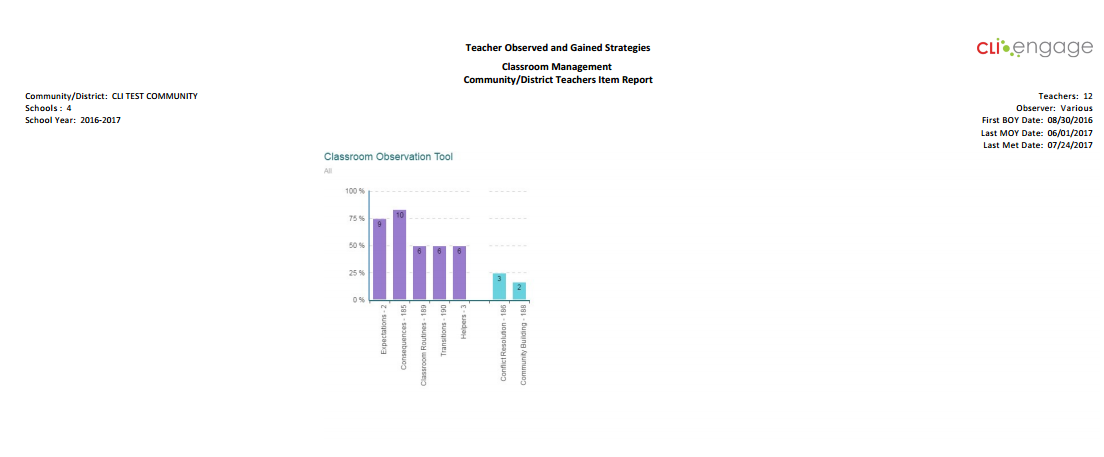
The COT item report displays those items that were observed. This example is a community/district-wide cumulative report. Note the item description at bottom of each The first column here displayed reveals 75 % (9 teachers of 12) were observed using this strategy.
Step
26
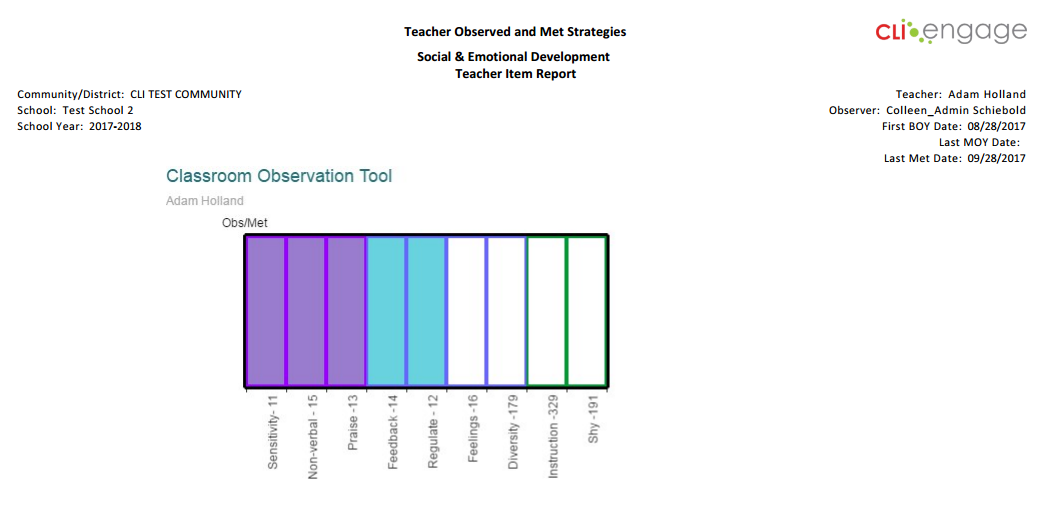
View an individual teacher’s item report. Items are grouped by color to indicate Level 1 (purple) are basic supports for instructional change, Level 2 (blue) represent increasingly advanced instructional strategies Level 3 (green) priorities centering on highly differentiated instruction.
Step
27
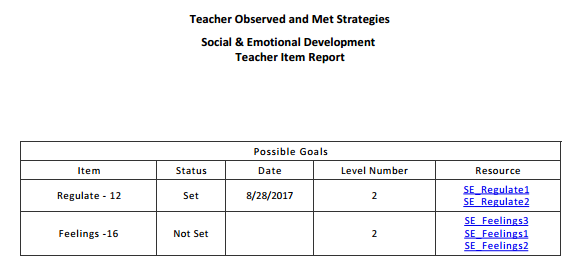
View the table below the bar graph to consider possible goals.
Step
28
Summary Report
Step
29
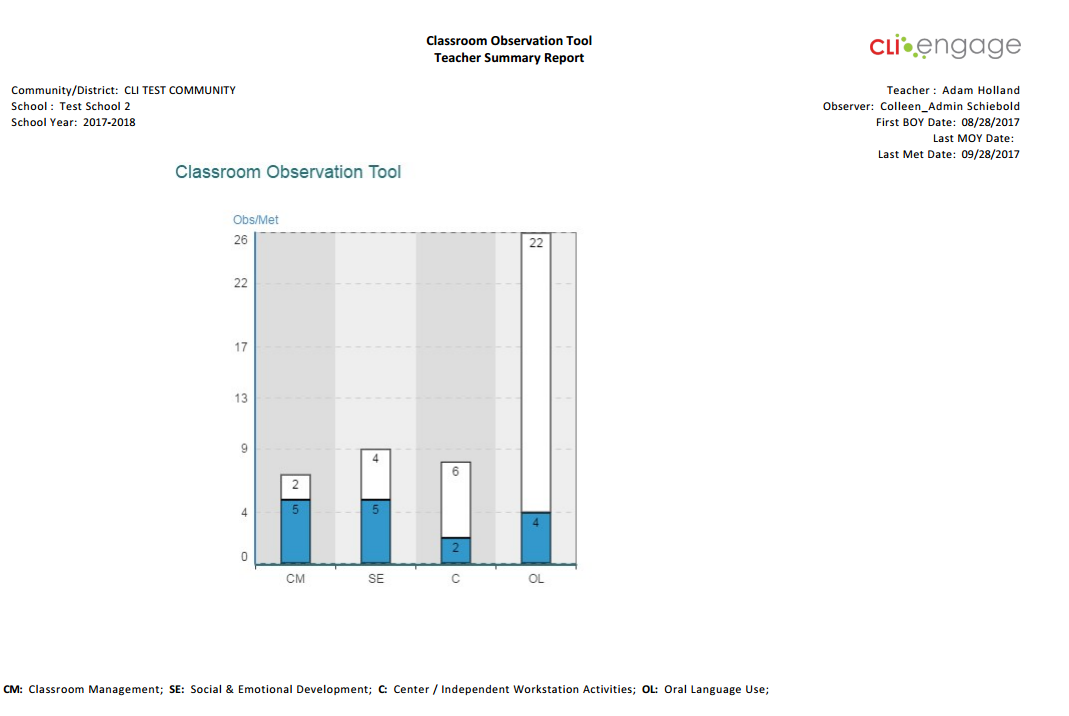
The summary report provides a summary of all continuous improvement actions taken for items observed and not observed.
Step
30
View the report based on the measure(s) you selected. The blue bar represents items observed. The number at the top represents the total number of indicator items within that domain.
Step
31
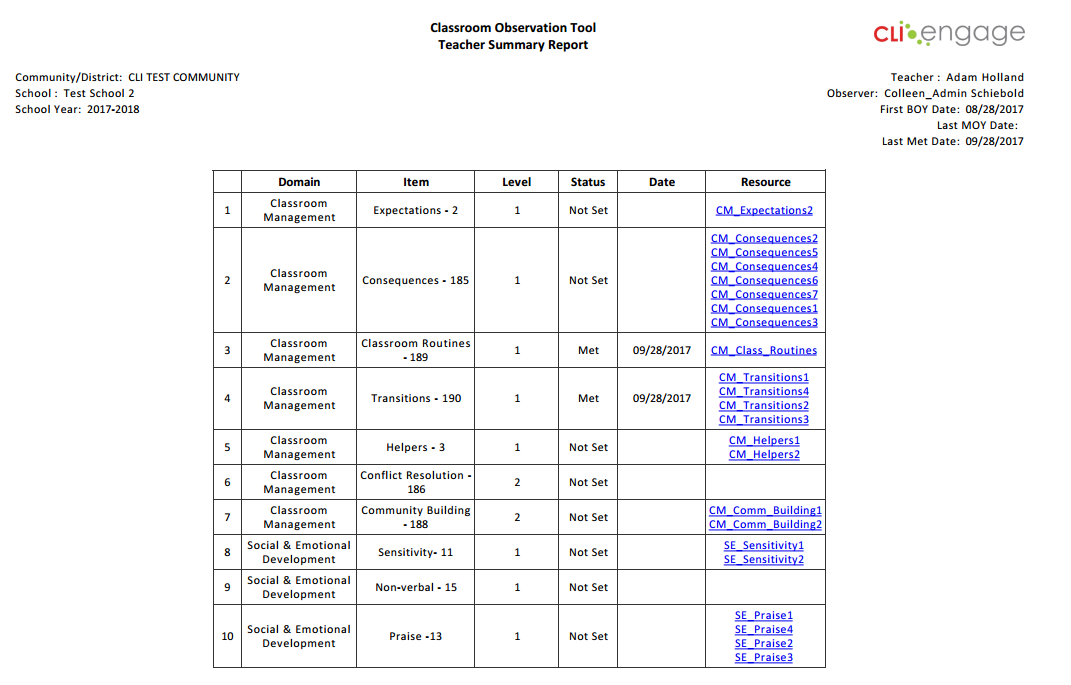
The table below the graph show items met and not set and has hyperlinks to exemplar video resources
Step
32
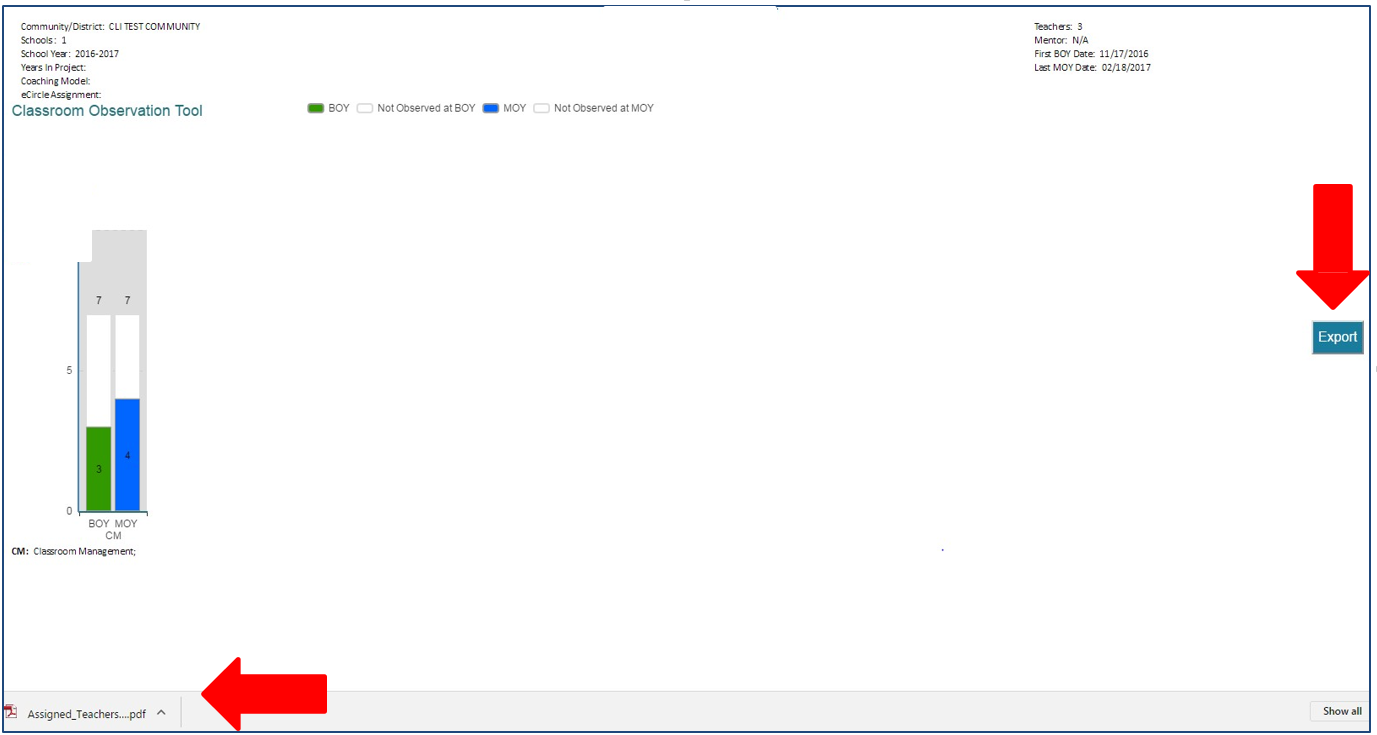
Select export  on any of the reports to create a PDF and save to your computer desktop.
This document was last modified on: August 27, 2021
